Category: Features
Mixed-Signal Waveform Viewer
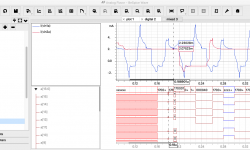
The new BeSpice Wave version has a new page for digital and mixed-signal data. Digital curves are shown in a specialized plot window. The analog curves are shown in a classical analog plot window. This makes BeSpice Wave a full mixed-signal waveform viewer. Download our free evaluation version to test…
Post Processing Spice Simulation Results
Many post processing algorithms and tools exist for Spice simulation results. However in many situations the existing tools are not sufficient or complicated to use. Things get even worse when you try to automate things or work on many curves from multiple simulation runs. An obvious solution is to write…
Qt Graph and Waveform Viewer
BeSpice Wave Widget can easily be integrated into graphical applications based on the cross-platform application framework Qt. It adds advanced and powerful graph viewer functionality to existing applications. It also allows to build new software using a time-saving component based approach. Qt4 and Qt5 are supported. The widget is available…
MPOD Data Logger Extension
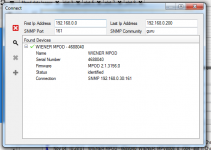
IMPORTANT: the MPOD data logger extension is no longer available. We merged it to Easy LV|HV, our new control software. The MPOD Data Logger extension has been implemented for Physical Instruments and their customers. It extends BeSpice Wave. The extension allows to connect to a Wiener MPOD crate over an…
Tcl/Tk Graph And Waveform Viewer
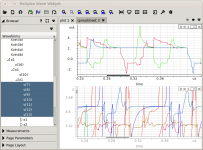
BeSpice Wave Widget can easily be integrated into Tcl/Tk applications. The module is provided as shared C library that can directly be loaded as Tcl module. It combines the performance of C with the flexibility of Tcl/Tk. The integration is extremely simple. Load the module. Create the Tk window. Insert…
Parse Spice Simulation Output With Matlab
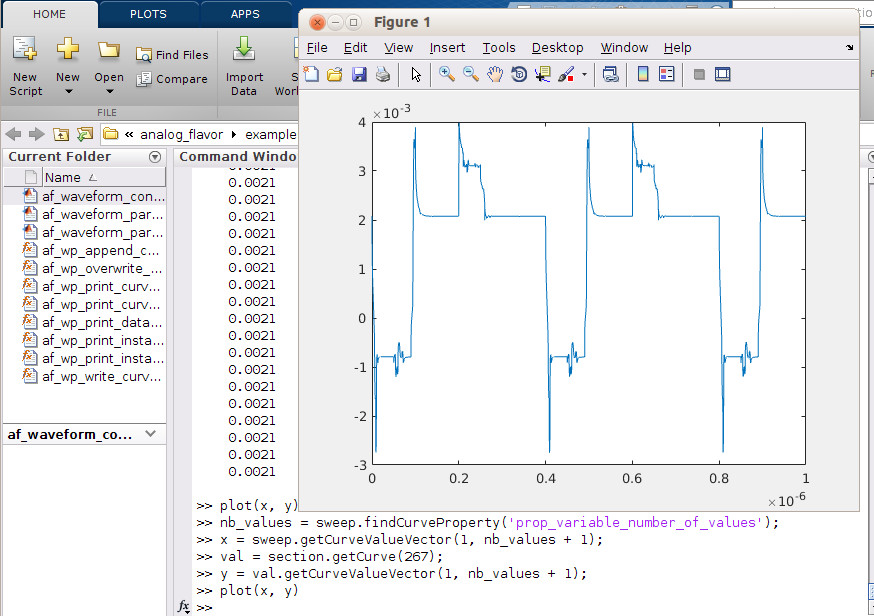
Matlab and it’s various toolboxes offer great possibilities to work with large numerical data sets. These possibilities are extensively used by designers for analyzing Spice simulation results. BeSpice Wave Parser, our waveform parser library is available as Matlab toolbox with the complete functionality of the C/C++ interface. This allows engineers…
Parse Spice Simulation Output With Tcl/Tk
Most user of EDA tools have at least basic knowledge of Tcl/Tk scripting and most EDA tools have a Tcl/Tk interface. BeSpice Wave Parser, our waveform parser library is not an exception. It has been extended to a Tcl module that exposes the complete functionality of the C/C++ interface. This…
Parse Spice Simulation Output With Python
Python modules like Pandas, Anaconda and SciPy offer great possibilities to work with large numerical data sets. These possibilities to manipulate numerical data can do a great job for analyzing Spice simulation results. BeSpice Wave Parser, our waveform parser library has been extended to a Python module with the complete…
Eye Pattern or Eye Diagram
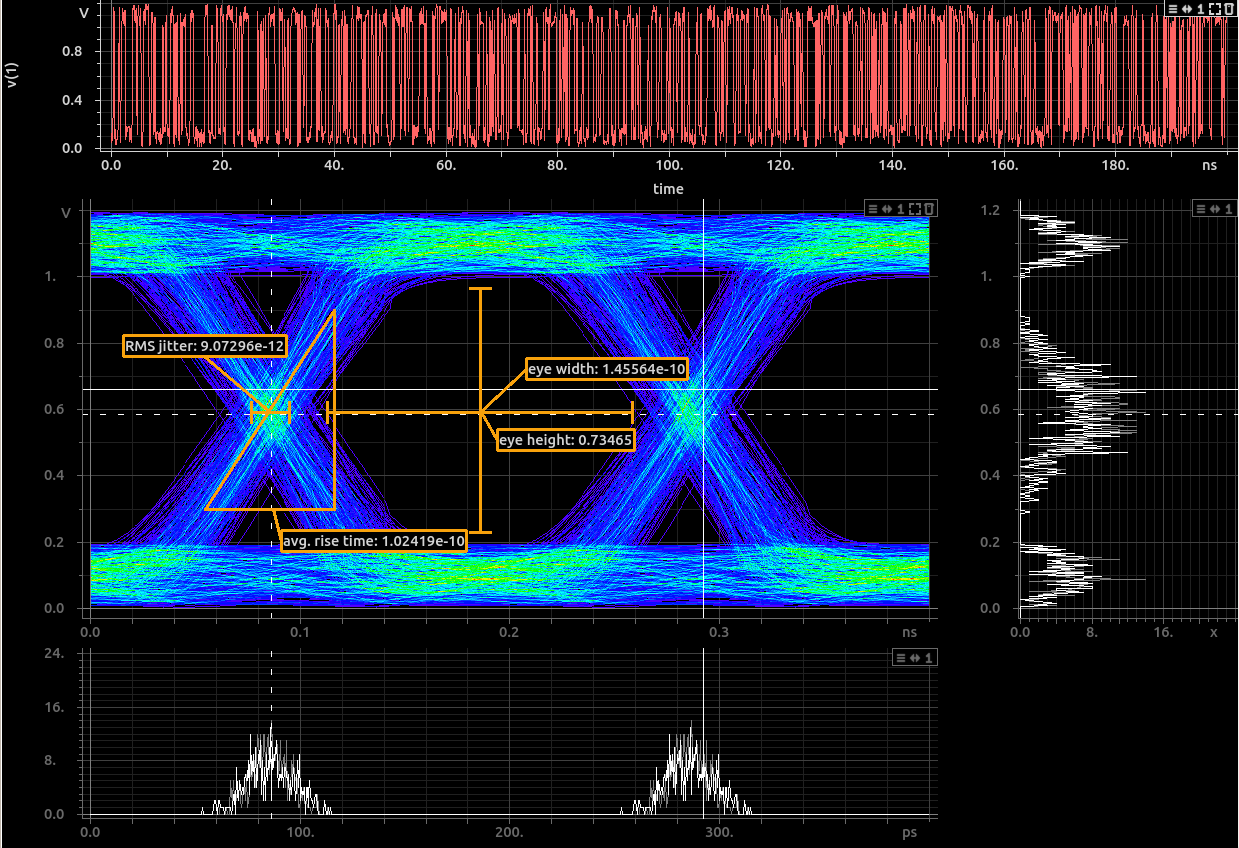
Eye patterns or eye diagrams are used to quickly and accurately measure the quality of a digital signal. They are built by folding a waveform into a single graph. The resulting graph will resemble to an eye. Measuring the eye diagram’s characteristics allows to determine the electrical quality of the…

