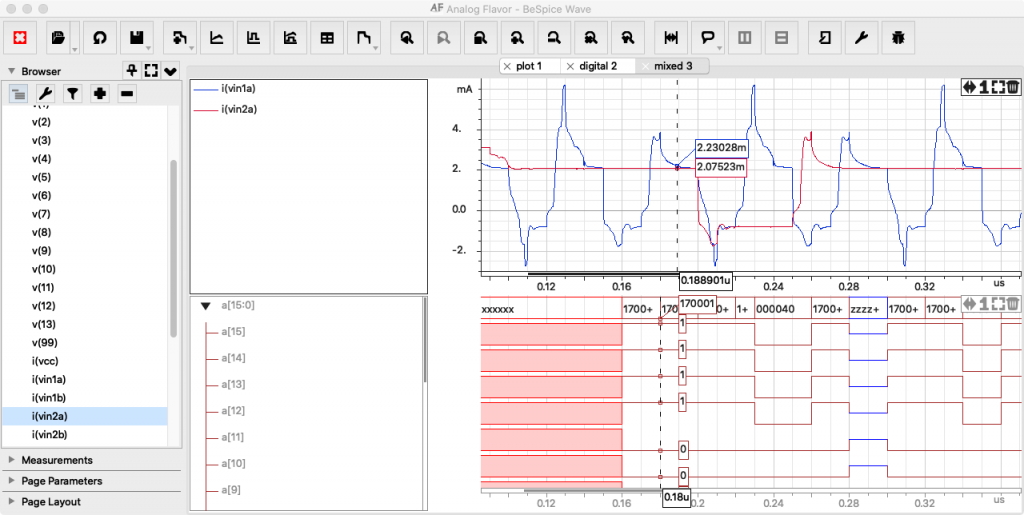
The new BeSpice Wave version has a new page for digital and mixed-signal data. Digital curves are shown in a specialized plot window. The analog curves are shown in a classical analog plot window. This makes BeSpice Wave a full mixed-signal waveform viewer.
Download our free evaluation version to test this new feature. Open one or several data files. Open a mixed-signal page and drag the curves to the new page.
The evaluation software supports VCD, CSV, Spice3 raw files and Xyce PRN files. Other file formats might require the full version.
To allow more versatility, curves can be dragged from one plot to the other. That means that analog and digital curves can be mixed. Each curve representing a digital bus can be expanded to show it’s bit values.
The x-axis of the 2 plots are synchronized. As a consequence the two plots always show the same zoom range.