
BeSpice Wave plugin for StarVision Video
This video shows an early version of the BeSpice Wave plugin for StarVision / SpiceVision:


This video shows an early version of the BeSpice Wave plugin for StarVision / SpiceVision:
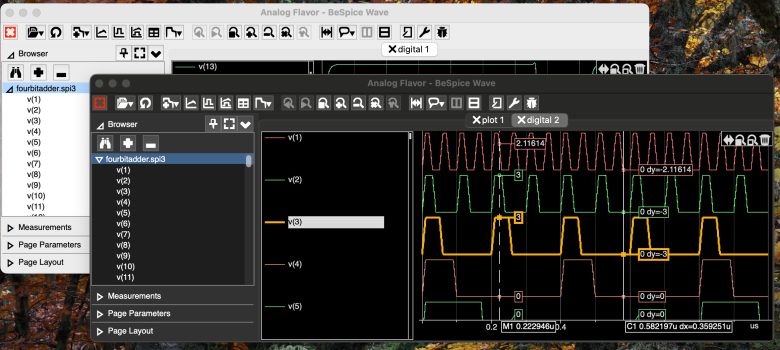
The Mac version of BeSpice Wave, our waveform viewer has been updated. Instead of being based on Qt it now uses the Cocoa API as underlying framework. This allows us to have a better support for scaled, high DPI displays and dark themes. Our aim was to make the application…
BeSpice Wave is a perfect waveform viewer for ngspice as it supports it’s raw binary and ascii waveform format. Ngspice is an open source spice simulator that is directly based on the legendary Berkley spice simulator. A raw waveform file is generated if the “–rawfile=FILE” command line option is specified…
Recently we have delivered an new control software to iseg. The software is called iseg THQ controls and as the name suggests, is has been designed to control iseg THQ modules. The software can be downloaded from the support -> downloads page of the iseg website. The below video gives…
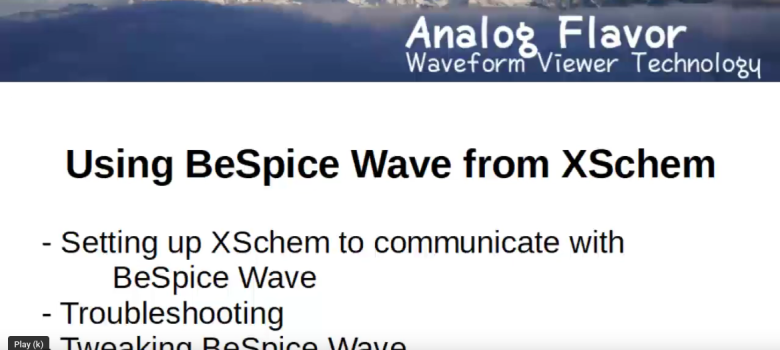
Recently we have worked with Stefan Schippers from XSchem to interface BeSpice Wave with XSchem. XSchem is an open source schematic editor. BeSpice Wave is our graphical waveform viewer. This solution allows to visualize simulation results for SPICE simulations from XSchem. If you are looking for a waveform viewer for…
When Cadence Spectre performs a simulation, it writes all simulation results to a directory. This directory can be opened for exploring the simulation results. By default these files are in PSF or PSFXL format. Here we will give a short overview on the PSF and PSFXL file structure. The most…
Analog regression testing is an essential part of analog design verification. Regression test are used to validate analog behavioral models. They also make sure that a previouslytested analog block still performs as expected after a change. Once analog regression tests have been set up, they can also facilitate other tasks:…
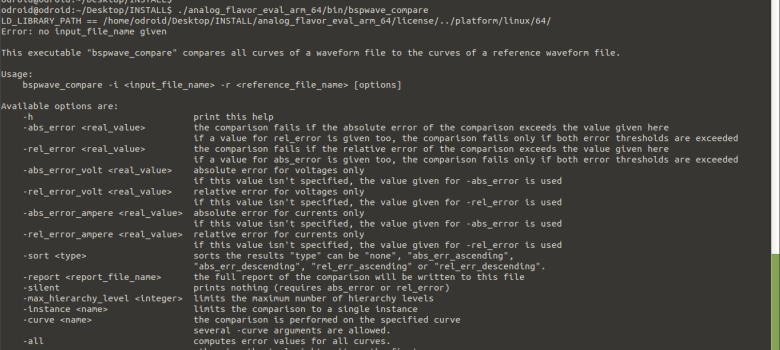
The algorithms used for analog waveform comparisons can be straightforward. You can simply traverse all curves in a file and find the matching curve in a reference file. Now compute the difference between 2 curves and integrate the result to obtain the absolute error. Dividing this by the norm of…
Our waveform parser makes reading PSF files from Python easy. For this purpose we have extended our parser library to a self-contained Python module. This module is implemented as a C/C++ extension to Python. As a consequence you get the full performance of a C/C++ library and the ease of…
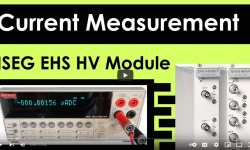
Physical Instruments has published a video on current measurement accuracy for high voltage power supply modules. The video shows how to make sure your high voltage power supply matches even the tightest specifications. In general checking the data sheet should be sufficient. However if you are in doubt, you can…